Create line plots
Key Notes :
1. Understanding Data: Introduce the concept of data collection. Explain that data can be collected through surveys, measurements, or counting.
2. Organizing Data: Teach students how to organize the collected data. For instance, if the data involves favorite colors or the number of pets owned by students, they’ll need to sort and count these values.
3. Constructing a Line Plot: Explain the structure of a line plot – a simple graph that displays data using ‘X’s or other symbols above a line. Each ‘X’ represents the frequency or number of times a value appears in the data.
4. Scale and Labels: Teach how to label the axes (x and y), demonstrating the use of a scale appropriate for the range of data collected.
5. Placing Data on the Line Plot: Show students how to plot the data points from their collected information on the line plot. For instance, if they collected data on the number of pets students own (such as 0, 1, 2, etc.), they will mark the occurrences of each value on the plot.
6. Analyzing the Line Plot: After plotting the data, help students interpret the information displayed. They can compare quantities, identify the most and least frequent data, and draw conclusions based on the line plot.
7. Real-World Applications: Provide real-world examples to illustrate the relevance of line plots, such as tracking favorite ice cream flavors or the number of books read by classmates. Encourage students to create their line plots based on such examples.
8. Practice and Reinforcement: Offer practice activities and exercises for students to create line plots based on different sets of data. This reinforces their understanding and skills in representing data using line plots.
9. Group Activities: Encourage group activities where students collect data collaboratively, analyze the information, and create line plots together. This helps in teamwork, sharing ideas, and comparing results.
10. Fun and Creativity: Engage students in fun activities that involve creating line plots, such as games, puzzles, or creative challenges. This fosters a positive attitude towards learning and applying this skill.
Learn with an example
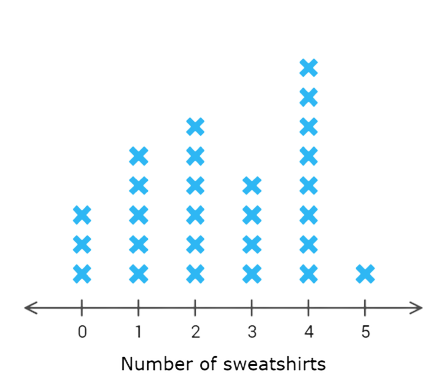
✈️ A clothing store asked some students how many sweatshirts they owned. ✈️ Use the data in the table to complete the line plot below.
| Sweatshirts | |
|---|---|
| Number of sweatshirts | Number of students |
| 0 | 3 |
| 1 | 5 |
| 2 | 6 |
| 3 | 4 |
| 4 | 8 |
| 5 | 1 |
✈️ Click to select the X’s. To clear a column, click on the number line below it.
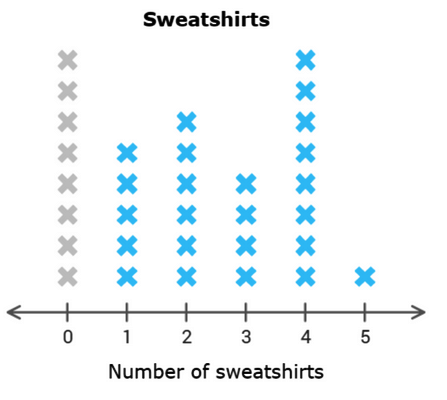
- The first missing piece of data is for 0. Find the row for 0 in the table. 3 students have exactly 0 sweatshirts. Select 3 X’s in the column above 0.
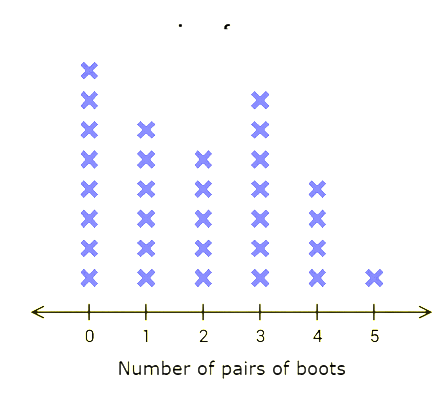
✈️ Some students compared how many pairs of boots they own.Use the data in the table to complete the line plot below.
| Pairs of boots | |
|---|---|
| Number of pairs of boots | Number of students |
| 0 | 8 |
| 1 | 6 |
| 2 | 5 |
| 3 | 7 |
| 4 | 4 |
| 5 | 1 |
✈️ Click to select the X’s. To clear a column, click on the number line below it.
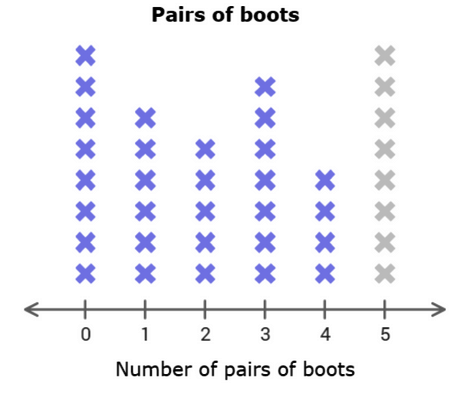
- The first missing piece of data is for 5. Find the row for 5 in the table. 1 student owns exactly 5 pairs of boots. Select 1 X in the column above 5.
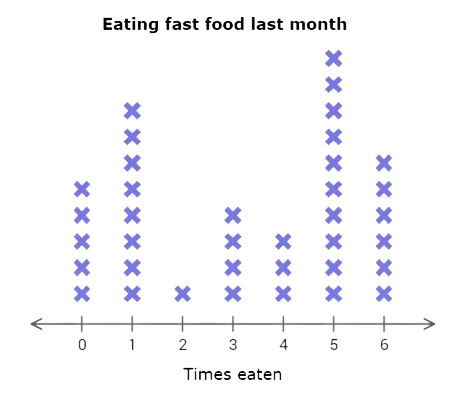
✈️ During health class, the students reported the number of times they ate fast food last month Use the data in the table to complete the line plot below.
| Eating fast food last month | |
|---|---|
| Times eaten | Number of students |
| 0 | 5 |
| 1 | 8 |
| 2 | 1 |
| 3 | 4 |
| 4 | 3 |
| 5 | 10 |
| 6 | 6 |
✈️ Click to select the X’s. To clear a column, click on the number line below it.
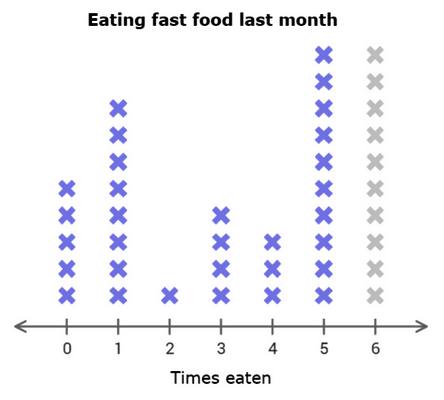
- The first missing piece of data is for 6. Find the row for 6 in the table. 6 students ate fast food exactly 6 times last month. Select 6 X’s in the column above 6.
Let’s practice!🖊️